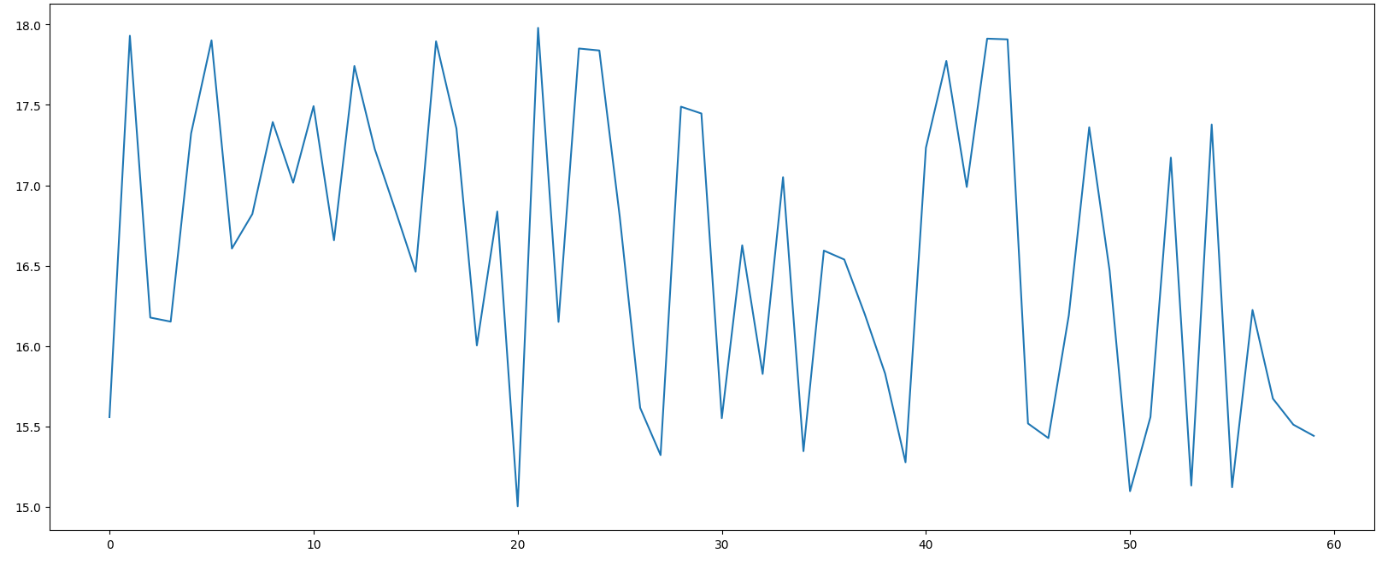
准备数据并画出初始图
准备数据并画出初始图
import matplotlib.pyplot as plt
import random

# 0. 准备数据
x = range(60)
y_shanghai = [random.uniform(15, 18) for i in x]

# 1. 创建画布
plt.figure(figsize=(20, 8), dpi=100)

# 2. 绘制图像
plt.plot(x, y_shanghai)

# 3. 图像显示
plt.show()
import matplotlib.pyplot as plt
import random
# 0. 准备数据
x = range(60)
y_shanghai = [random.uniform(15, 18) for i in x]
# 1. 创建画布
plt.figure(figsize=(20, 8), dpi=100)
# 2. 绘制图像
plt.plot(x, y_shanghai)
# 3. 图像显示
plt.show()